Stripe is widely used for capturing payments, subscriptions, credits, and refunds with precision.
But if you want to use data from Stripe to get better insights into operational questions like revenue health, customer usage, and routine finance reviews, it is anything but easy.
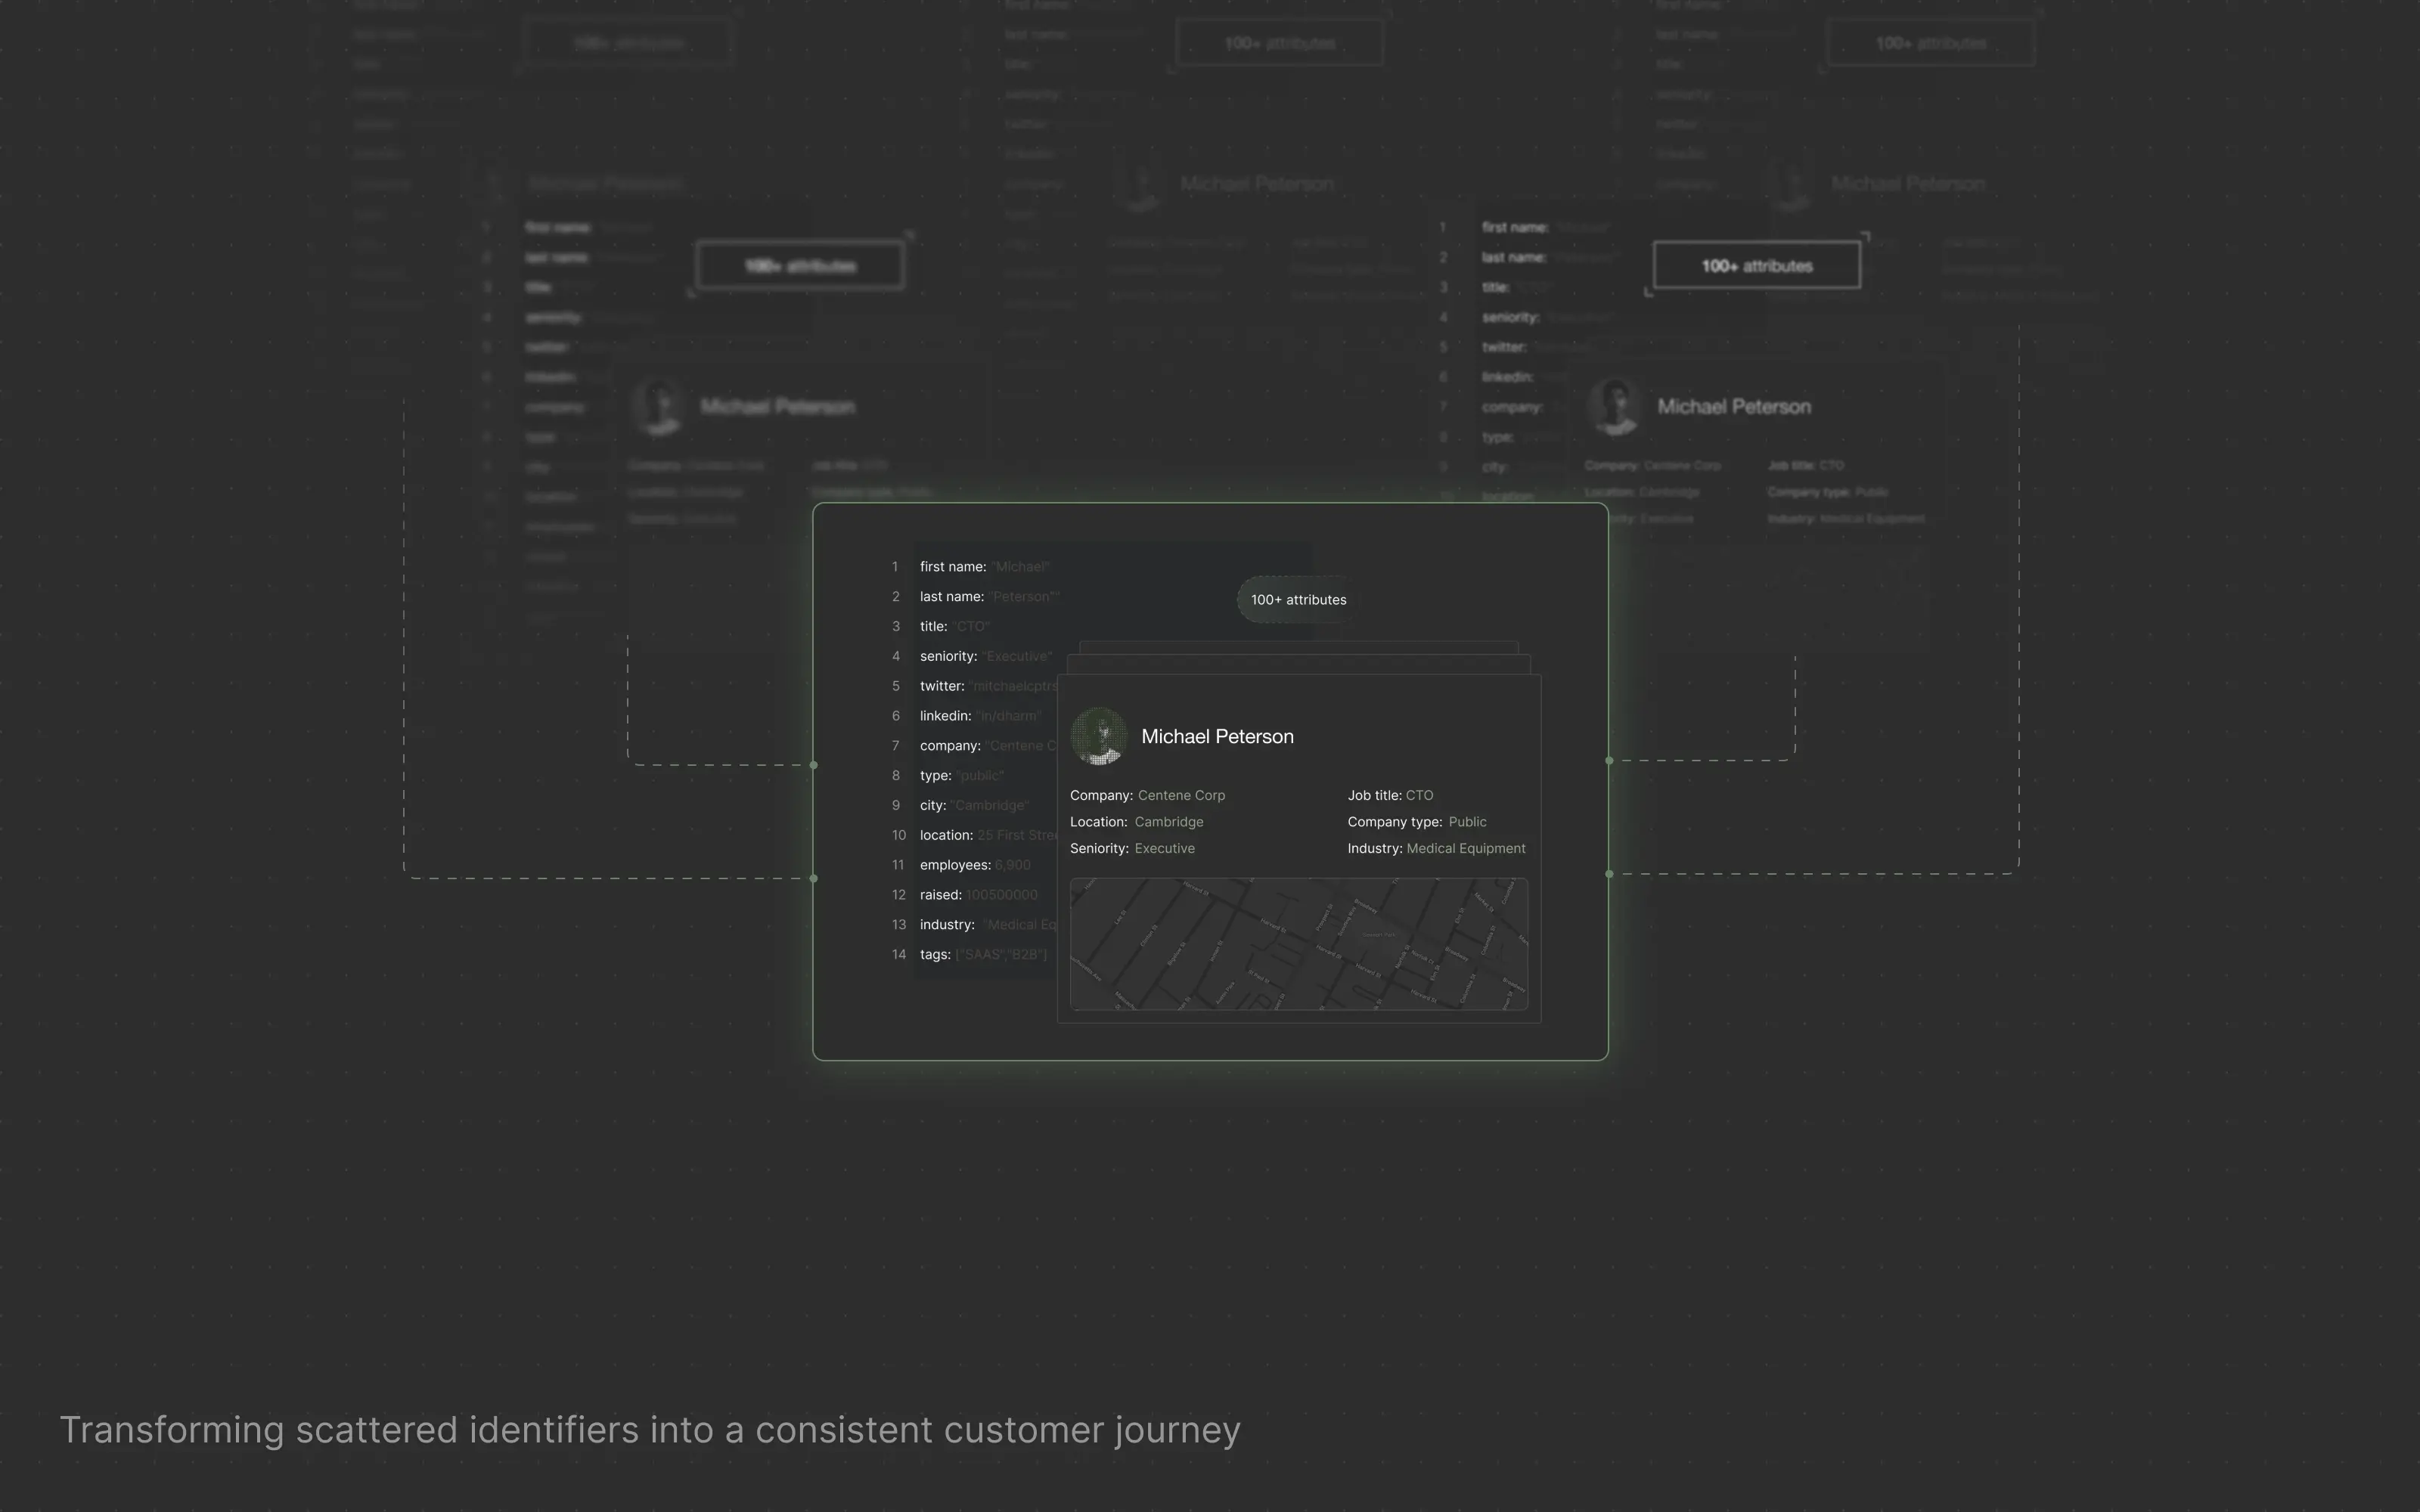
The data is readily available, but it's spread across events, schemas, and identifiers that make consistent analysis hard to share across teams.
To solve this, we built a custom lightweight pipeline that pulls billing data from Stripe, normalizes it using n8n, and outputs a shared dataset in Google Sheets. We wanted to share how we did it, including some unexpected challenges and solutions.
How we turned billing events into something usable
Stripe billing events arrive with different schemas, timing semantics, and identifiers. Revenue figures depend on grouping decisions that are rarely obvious and often context-dependent. Even minor inconsistencies in how records are joined or filtered can introduce uncertainty and slow down analysis.
For finance and operations, this means time spent verifying these numbers before they can be used with confidence. When you're trying to answer questions like "Did our Q3 promotion actually drive renewals?" or "What's our effective revenue per customer this month?", you need more than raw event logs.
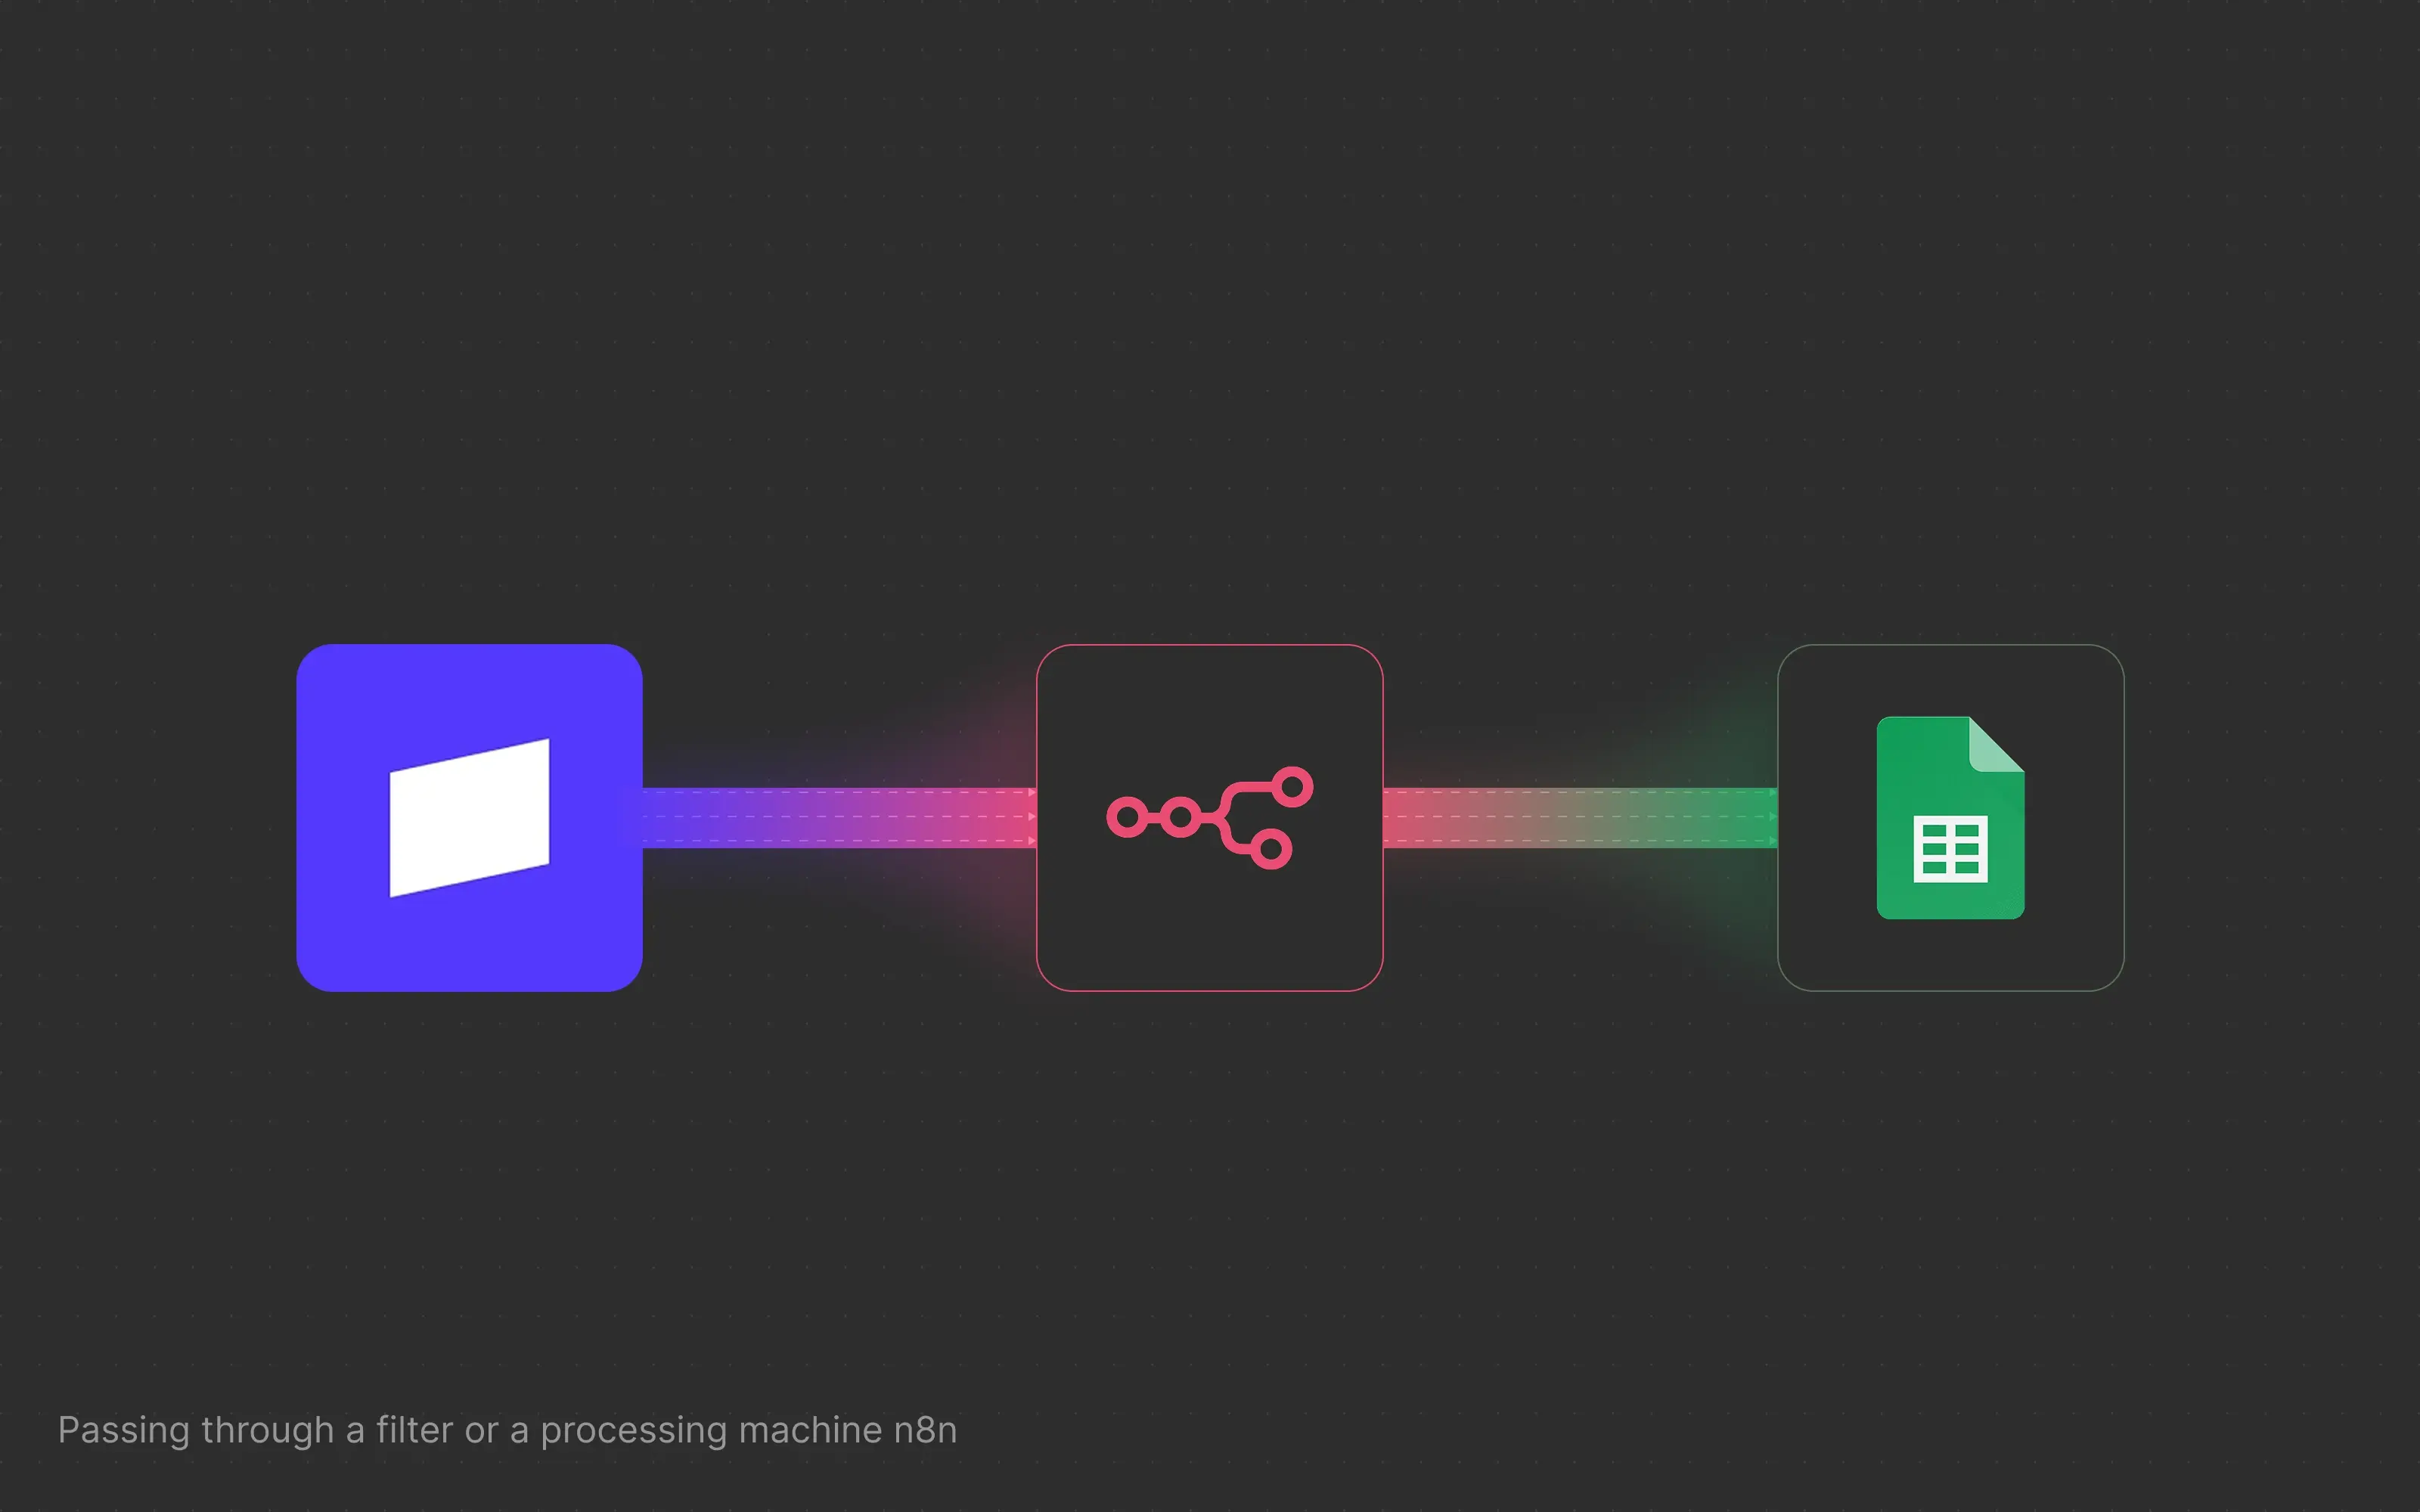
Instead of starting with a polished dashboard, we focused on producing an output that could be closely examined and reconciled when questions came up — a set of flat tables in Google Sheets with one row per charge, normalized across Stripe's event schema. That led to a simple, inspectable internal pipeline built around three tools: Stripe's Search API as the data source, n8n to handle orchestration and normalization, and Google Sheets as the shared output.
With Stripe as the system of record for billing events, we used n8n automations to handle orchestration, normalization, and aggregation. Google Sheets served as the final output, which was intentionally straightforward and easy to inspect.
The aim here was not to automate everything or to present a refined interface. It was to establish a repeatable process that turned raw events into a shared reference point. The resulting tables were easy to review, easy to question, and easy to trace back to their sources.
This approach gave us something valuable: transparency. If someone questions a number or revenue event, we could walk through the exact transformations that produced it.